8 KPIs to Measure Blog Performance & 5 Reporting Tools

As a blog owner, you’re always looking for ways to measure blog performance and assess whether your blog is successful. After all, why put all that effort into writing if no one is reading it?
There are numerous metrics or KPIs you can use to measure blog performance, but which ones are the most important? And how do you interpret the data? And what are KPIs anyway?
Should measuring blog performance seem like a confusing and daunting task, don’t fear! In this blog post, we’ll walk you through important metrics and tools you can use to assess your blog’s performance without flooding you with jargon. So, if you’re ready to start measuring your blog’s performance, read on!
What Are Blog Analytics?
Data analytics is the process of examining raw data from various sources and converting it into valuable insights to make informed decisions.
Now blog analytics is the same thing in the blogging context!
By using a qualitative and quantitative mix of data, you can use blog analytics to measure your blog’s performance by analyzing a number of metrics. These are known as key performance indicators (KPIs) such as traffic, visits, engagement rate, clicks, conversions, subscribers and so on. (KPIs are what you need to KeeP and I on.)
Why Do Blog Analytics Matter?
Blog analytics show you what’s working, what’s not and what needs tweaking.
These analytics are a big time-saver, cost-saver, and lifesaver (you’ll see!). It answers important questions showing how successful your blogging efforts are.
Questions such as:
The number of clicks and traffic aren’t the only performance indicators to consider. What if users click on your content but immediately exit without skimming or engaging with it?
Instead of yielding positive results, these clicks increase the bounce rate of your blog (more on this later) and ultimately question your authority and the quality of your content. This indicates that your content is not “helpful” enough in the eyes of Google.
Your goal should be to get your reader to stay on your blog post for the maximum time, engage and share your content, and get them to convert by clicking on a button (take an action) or at least keep coming back for more.
Now that you know why blog analytics is so important to measure your blog’s performance, let’s dive deeper into the KPIs of your blog!
8 KPI Metrics to Measure Blog Performance
To ensure the quality, authority, and ‘helpfulness’ of your content and to monitor how your blog is performing, you need to keep an eye on the following KPIs of the blog:
- Blog Traffic (Visits and views)
- Time on Page
- Bounce Rate
- New vs Returning Visitors
- Traffic by Channel
- Click-through Rate (CTR)
- Conversion Rate
- Email Metrics
Let’s have a look…
1. Blog Traffic (Visits and views)
Blog traffic (website traffic) refers to the number of people who visited your blog.
Traffic is measured as ‘visits’, also known as ‘sessions’. While a visit determines the number of times your blog was visited by a user, page views refer to the number of times users visited a particular page of your blog. Though it all seems obvious, tracking the traffic on a daily, weekly, or monthly basis gives you valuable insights, such as:
All these insights help you identify patterns to know what is working and what is not.
2. Time on Page
Time on page measures how long someone stayed on a particular page and engaged with your content. It is an important indicator of your content’s quality and readability. The more engaging the content, the longer it holds users’ attention.
If your content is boring, flooded with adverts, or not to the reader’s liking, they will exit the page very quickly. Google views this as a sign that the quality of the page is not great. Next time Google has the option to direct a visitor to this page, or another, the other could get preference if your page has a low time-on-page metric.
But lower time on a page doesn’t necessarily mean that there’s a problem with your content’s quality. Sometimes, you need to work on the technical SEO of your website or page, page loading speed, image quality, and optimization on all devices.
3. Bounce Rate
A bounce is a single-page session on your blog. In analytics terms, a bounce rate is the percentage of all sessions on your website where users came, viewed a single page and then left without engaging with other pages. Getting a zero bounce rate is practically impossible. The optimal bounce rate in Google Analytics is somewhere between 26 to 40%.
Besides checking the content quality, check your website design, page loading speed, as well as mobile responsiveness, as most bounces occur on mobile devices.
Also, add relevant internal links, ‘read more’ links, and consider adding a sidebar widget to your blog to show a couple of the most recent or high-performing blog posts to encourage users to stick around for longer.
The configuration for ‘bounce rate‘ will change in the near future, as it will take into account Time on Page and a few other metrics as well. It can happen that a visitor visits one page, read it from top to bottom, thoroughly enjoy it and then leave. The new metrics will avoid counting this one happy visitor as a bounce.
4. New vs Returning Visitors
If users find your content valuable, they will keep returning for more, share it with their network, and will also get you new visitors.
Google has an expiration date of two years on returning visitors. If someone visited your site in the last two years from the same device, he/she is counted as a returning visitor. If someone visits your blog from a desktop and then through a mobile device, Google Analytics will count that person as two visitors.
This is where your email marketing strategy can come into play. With the new vs returning analytics data, you can send welcome emails to new visitors or offer discounts and coupons to returning visitors.
If your returning visitors are decreasing in number, there might be something wrong with your content quality or site design.
5. Traffic by Channel
Where is the traffic to your blog coming from?
Is it through social media, email, or referrals? Do you have ad campaigns running, meaning the traffic is coming from paid search? Or is it from organic search, meaning someone entered a search term on a search engine and was led to your site?
In all these cases, which search terms brought them to your doorstep? Known as ‘keywords’ it is important to know which ones are doing good, described as ‘ranking keywords’.
The information about traffic sources gives you valuable insight into which channels are performing the best. Also, you can identify the shortcomings (deficiencies) and make use of better keywords to get better traffic.
6. Click-through Rate (CTR)
Click-through rate or CTR is the ratio of the number of users who clicked on your link (ad, listing, email, page) versus the number of users who viewed it.
After a typical search, a user is given a list of results. This page of results is known as a SERP – Search Engine Results Page. If the user sees your blog’s listing on the SERP, among ten others, and click on yours instead of the others, then that is defined as a click-through.
If a hundred people saw your listing because of a search, then that will count as 100 impressions. Should 10 people out of a hundred click on you listing, your click-through rate will be 10%. (This is a simplified explanation.)
CTR = Clicks / Impressions
The CTR shows how well your ad, listing, or email is performing. If your CTR is low, try improving the content on your advert, listing or email.
7. Conversion Rate
Conversion happens when a user takes an action you desire, such as filling a form, signup for a newsletter, subscribe to email, or make a purchase. It means you’ve successfully converted your blog leads to customers.
If your CTR is high, but your conversion rate is lower, it shows that even though users are clicking on the links, they are not completing the desired action. This means you need to work on optimizing your landing page or improving your ‘call to action’ – CTA – that which the visitor must do.
Try the following improvements: place clear CTA buttons on your blog, landing page, emails, and adverts; create catchy designs, create urgency, and always do split testing or A/B testing to test various CTAs and see which one performs the best.
Here is an important piece of advice: Put a lot of thought into the text that goes on the CTA button. OK, or Click Here, or Get Started are all humdrum and unengaging. If this blog post was in fact an app that could measure your blog’s performance, the button text I would have used to get the reader to take action (i.e. use my app) would have been: “Measure my blog’s performance.”
8. Email Metrics
Your email subscribers are one of your most valuable assets, as they are the ones who’ve trusted you with access to their inboxes. Seeing how many email subscribers you have is a fair indication of how well your message was received and interpreted.
However, there is a distinction to be made between valuable email subscribers, those with an intent to use your services, and those who just wanted to get a freebie, and will never become a subscriber to your service. Whatever incentive you used to elicit someone to hand over their email address, must in itself indicate their interest in your service.
Once you have been provided email addresses of clients with a clear intention and interest in your service, make sure you make their experience count. Never abuse that trust and provide truly valuable and relevant content.
5 Analytics & Reporting Tools to Measure Your Blog Performance
There are several analytics tools to get automated and visual reporting of your blog’s performance. These tools are invaluable in helping you make decisions. Let’s have a look at five popular analytics tools.
1. Google Analytics
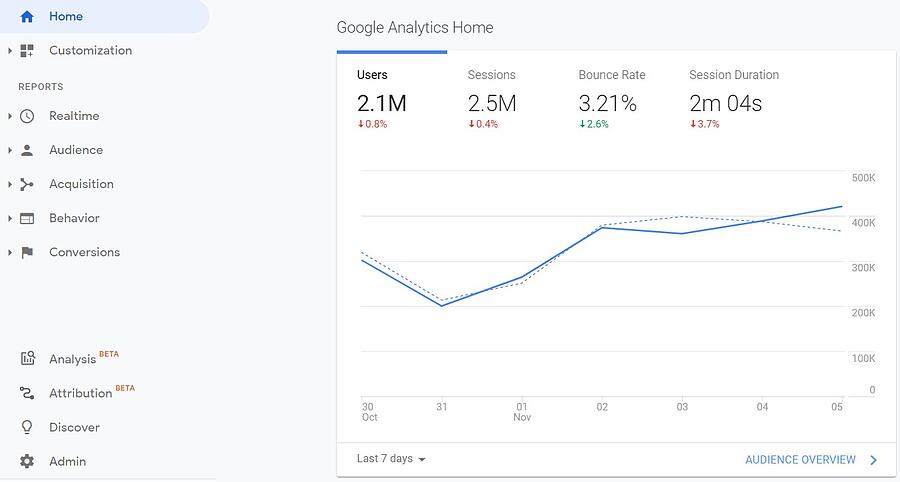
Google Analytics (GA) is an easy and free platform that pulls data from your website and creates visual reports to provide insights about your blog’s performance. Simply create a GA account and add a small piece of JavaScript measurement code to each page on your site. Whenever users visit your blog, this code will collect the information on
Once the information is collected, GA stores and organizes it and turns it into several handy reports based on the filters you use.
Google Analytics comes in two pricing tiers: The standard version is absolutely free for everyone and Google Analytics 360 is an expensive premium version with advanced features for enterprise-level users.
2. SEMrush
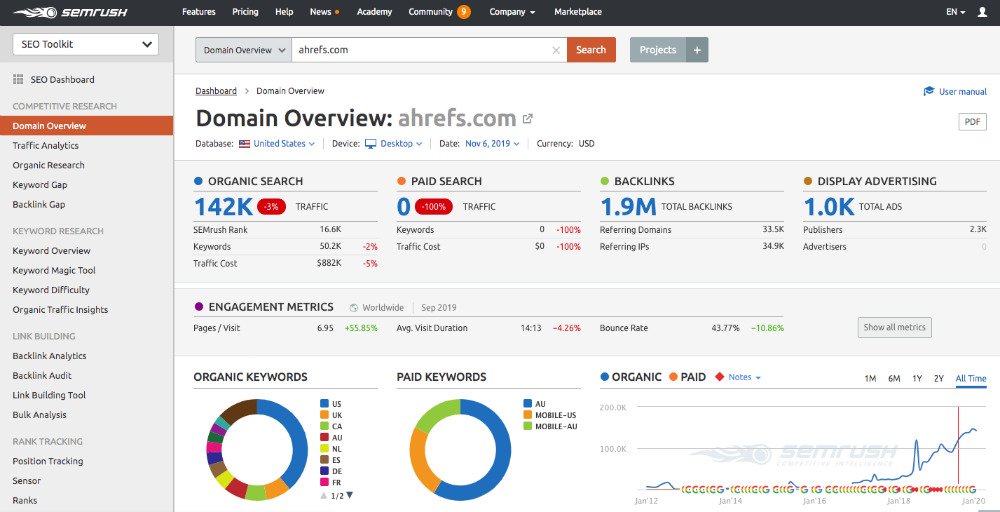
SEMrush is an all-in-one SaaS (Software as a Service) digital marketing platform that helps you run effective SEO & PPC (Pay Per Click) campaigns, tracks and analyzes your website, conducts keyword research and competitor analysis and enhances your online visibility. SEMrush is a powerful tool that integrates with Google Analytics and offers what GA offers plus more.
While GA offers strictly internal analytics, SEMrush shines in the area of competitor analysis (external). It not only measures your traffic performance like GA but also helps you analyze your competitor’s search presence and the keywords they are ranking for. Some of the standout tools and features in the SEMrush toolkit are:
SEMrush offers 3 main pricing plans namely Pro, Guru, and Business, all currently less than $500 per month.
3. Ahrefs
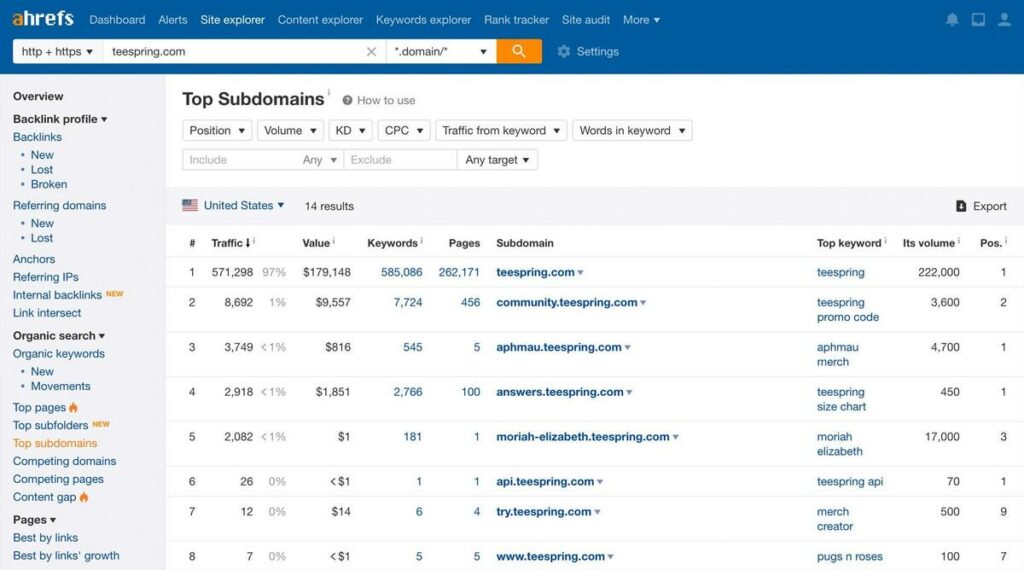
Commonly used as a backlink authority checker, Ahrefs is another powerful tool to measure and analyze your blog’s performance with keyword research, SEO, site audits, rank tracking, and competitor analysis. Some of the handy Ahref’s tools include:
On top of these core tools, Ahrefs also offers several free tools such as a Webmaster tool, Backlink checker, Broken link checker, Website authority checker, Keyword Generator, and SERP checker. Ahrefs offers 4 pricing plans, namely Lite, Standard, Advanced, and Enterprise; all currently less than $1000 per month.
4. Google Search Console
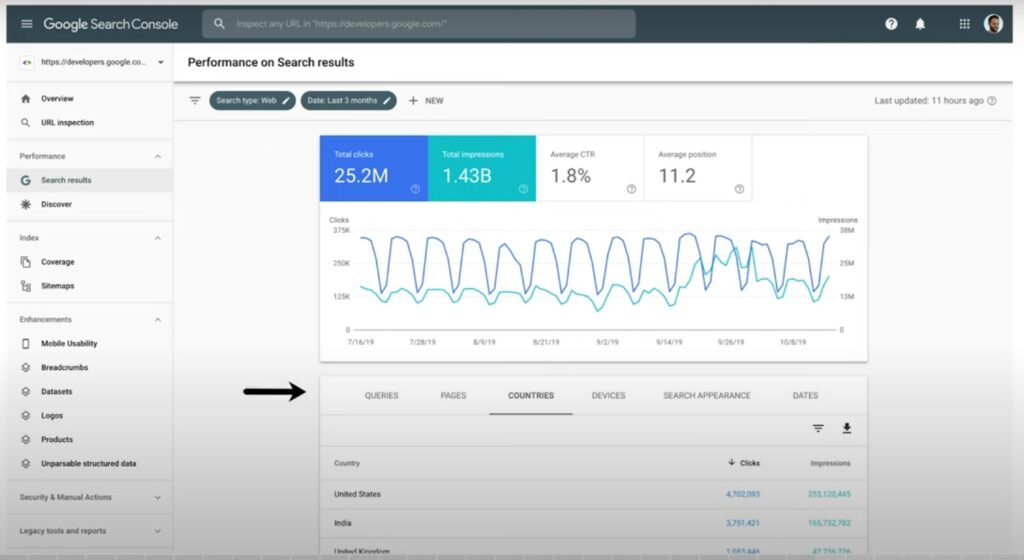
Formerly known as Google Webmaster Tools, Google Search Console (GSC) is a free tool offered by Google to help you monitor your blog’s performance, traffic and issues and get it ranked on Google. After you have verified the ownership of your website by creating a business account, Google Search Console helps with the following:
- Shows how often your blog appears in Google Search, and which search queries got it clicked.
- Fixes indexing problems and send alerts when Google encounters indexing, spam, or other issues on your blog.
- Shows you which sites link to your website.
- Troubleshoots issues for AMP (Accelerated Mobile Pages), mobile usability, and other search features.
- Lets you segment your data based on search queries, countries, time, and devices.
5. Clicky
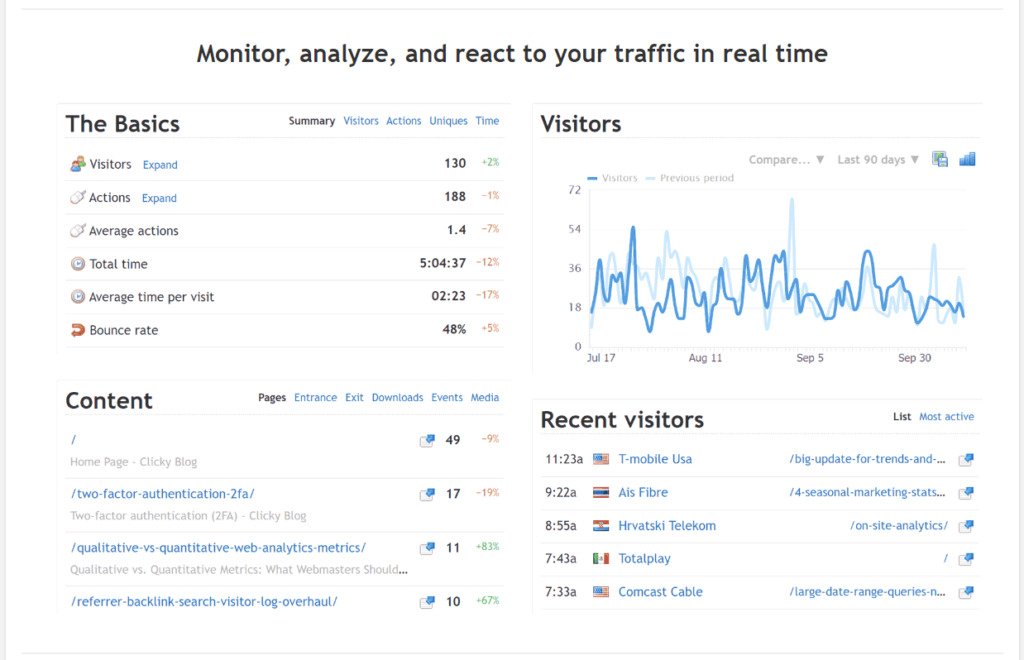
Clicky is a privacy-friendly, GDPR-compliant and cookieless tracking website analytics tool that monitors and analyzes your website traffic in real-time. Besides the basic analytics features, Clicky’s standout feature is heatmap tracking to show visually which part of your blog is getting the most attention.
Another feature is “Spy” which reveals every single activity and step the visitors take on your blog. The bot detection feature helps you get rid of all referral spam and get real human insights.
Besides a free plan and custom plan, Clicky offers 3 super affordable paid plans, namely Pro, Pro Plus and Platinum; all currently under $20. Users can save 33% on all plans if they pay annually.
Which Blog Analytics Solution Is Right for You?
Choosing the right blog analytics and reporting solution to measure your blog’s performance and success comes down to what metrics matter most to your blogging effort.
How would you best interpret the KPIs, and whether you have sufficient budget to afford a particular solution? Don’t get excited about the bells and whistles if you are never going to use the additional features. Focus on your blogging strategy first.
Google Analytics is hands down the best free tool for you if you are a small blog owner or just getting started. It offers all the reports you need to keep tabs on your audience and the way they interact with your content, plus the technical aspects of your blog like site speed and links. Combined with Google Search Console, they form an affordable and useful duo for the average blow owner.
While GA is the most popular free tool, it has some limitations, such as it doesn’t offer competitors’ intelligence, offers limited reporting, has a confusing interface, and lacks customization capabilities. You can always try the free trials of other web analytics solutions before deciding to go for the best one suited to your needs. But if you need a basic free blog analytics solution, Google Analytics is your tool!
Conclusion: KPIs to Measure Blog Performance
There is no reason to feel overwhelmed by the long list of metrics, statistics and reports which measure blog performance.
We’ve shared eight of the most important ones to focus on as a small blog owner.
As a tip, select one KPI to focus on for a while and see how it changes over time. Get a feel for what is ‘good’ and what is ‘bad.’
For example, you might see a bounce rate of 50 as high, but compared to your industry, competitors, and other blog posts, 50 might be fair. Track these metrics over an extended period to get to know them. That way if something changes drastically, you will pick it up and be prompted to investigate.
Although a blog is not a volatile environment, I have seen images disappear and links break. Competitors become more competitive, and a drop in click-through-rate or conversion for a particular post could mean various things. Check your posts and monitor your competitors, and adapt or improve where you can. That way you will keep your readers happy!
If you liked this post and think it might contain some gems that could help other people, please share and follow.
Do you need great content to keep your readers engaged?
WebCare crafts quality content for healthcare blogs using our team of top AI optimization experts. If your YMYL blog needs E-E-A-T, our AI writers provide the authority and credibility your blog needs. Sign up to get Early Access to this service.


